Collectors Overview
Performance profiles originate either from the user’s own means (i.e. by building their own collectors and generating the profiles w.r.t Specification of Profile Format) or using one of the collectors from Perun’s tool suite.
Perun can collect profiling data in two ways:
By Directly running collectors through
perun collectcommand, that generates profile using a single collector with given collector configuration. The resulting profiles are not postprocessed in any way.By Using job specification either as a single run of batch of profiling jobs using
perun run jobor according to the specification of the so-called job matrix usingperun run matrixcommand.
The format of resulting profiles is w.r.t. Specification of Profile Format. The
origin is set to the current HEAD of the wrapped repository.
However, note that uncommited changes may skew the resulting profile and Perun
cannot guard your project against this. Further, collector_info is
filled with configuration of the run collector.
All automatically generated profiles are stored in the .perun/jobs/
directory as a file with the .perf extension. The filename is by default
automatically generated according to the following template:
bin-collector-workload-timestamp.perf
Profiles can be further registered and stored in persistent storage using
perun add command. Then both stored and pending profiles (i.e. those not
yet assigned) can be postprocessed using the perun postprocessby or
interpreted using available interpretation techniques using perun show.
Refer to Command Line Interface, Postprocessors Overview and Visualizations Overview for more details
about running command line commands, capabilities of postprocessors and
interpretation techniques respectively. Internals of perun storage is described
in Perun Internals.

Supported Collectors
Perun’s tool suite currently contains the following three collectors:
Trace Collector (authored by Jirka Pavela), collects running times of C/C++ functions along with the size of the structures they were executed on. E.g. this collects resources such that function
searchover the classSingleLinkedListtook 100ms on single linked list with one million elements. Examples shows concrete examples of profiles generated by Trace CollectorMemory Collector (authored by Radima Podola), collects specifications of allocations in C/C++ programs, such as the type of allocation or the full call trace. Examples shows concrete generated profiles by Memory Collector.
Time Collector, collects overall running times of arbitrary commands. Internally implemented as a simple wrapper over
timeutilityBounds Collector, collects bounds of integer and, to some extent, heap-manipulating loops represented as so called ranking function. The collectors works as a wrapper over the Loopus tool. The collection is limited to source codes only, written in subset of C language, i.e. for some construction it might return wrong bounds (e.g. for switch statement). Moreover, the runtime of bounds depends on Z3 library.
All of the listed collectors can be run from command line. For more information about command line interface for individual collectors refer to Collect units.
Collector modules are implementation independent (hence, can be written in any language) and only requires simple python interface registered within Perun. For brief tutorial how to create and register new collectors in Perun refer to Creating your own Collector.
Trace Collector
Trace collector collects running times of C/C++ functions. The collected data are suitable for further postprocessing using the regression analysis and visualization by scatter plots.
Overview and Command Line Interface
perun collect trace
Generates trace performance profile, capturing running times of function depending on underlying structural sizes.
SystemTap (+ corresponding requirements e.g. kernel -dbgsym version)Example of collected resources is as follows:
{
    "amount": 11,
    "subtype": "time delta",
    "type": "mixed",
    "uid": "SLList_init(SLList*)",
    "structure-unit-size": 0
}
Trace collector provides various collection strategies which are supposed to provide sensible default settings for collection. This allows the user to choose suitable collection method without the need of detailed rules / sampling specification. Currently supported strategies are:
Note that manually specified parameters have higher priority than strategy specification and it is thus possible to override concrete rules / sampling by the user.
The collector interface operates with two seemingly same concepts: (external) command and binary. External command refers to the script, executable, makefile, etc. that will be called / invoked during the profiling, such as ‘make test’, ‘run_script.sh’, ‘./my_binary’. Binary, on the other hand, refers to the actual binary or executable file that will be profiled and contains specified functions / USDT probes etc. It is expected that the binary will be invoked / called as part of the external command script or that external command and binary are the same.
The interface for rules (functions, USDT probes) specification offers a way to specify profiled locations both with sampling or without it. Note that sampling can reduce the overhead imposed by the profiling. USDT rules can be further paired - paired rules act as a start and end point for time measurement. Without a pair, the rule measures time between each two probe hits. The pairing is done automatically for USDT locations with convention <name> and <name>_end or <name>_END - or other commonly found suffixes. Otherwise, it is possible to pair rules by the delimiter ‘#’, such as <name1>#<name2>.
Trace profiles are suitable for postprocessing by Regression Analysis since they capture dependency of time consumption depending on the size of the structure. This allows one to model the estimation of trace of individual functions.
Scatter plots are suitable visualization for profiles collected by
trace collector, which plots individual points along with regression
models (if the profile was postprocessed by regression analysis). Run
perun show scatter --help or refer to Scatter Plot for more
information about scatter plots.
Refer to Trace Collector for more thorough description and examples of trace collector.
Usage
perun collect trace [OPTIONS]
Options
- -e, --engine <engine>
Sets the data collection engine to be used: - stap: the SystemTap framework - ebpf: the eBPF framework
- Options:
stap | ebpf
- -s, --strategy <strategy>
Required Select strategy for probing the binary. See documentation for detailed explanation for each strategy.
- Options:
userspace | all | u_sampled | a_sampled | custom
- -f, --func <func>
Set the probe point for the given function as <lib>#<func>#<sampling>.
- -u, --usdt <usdt>
Set the probe point for the given USDT location as <lib>#<usdt>#<sampling>.
- -d, --dynamic <dynamic>
Set the probe point for the given dynamic location as <lib>#<cl>#<sampling>.
- -g, --global-sampling <global_sampling>
Set the global sample for all probes, sampling parameter for specific rules have higher priority.
- --with-usdt, --no-usdt
The selected strategy will also extract and profile USDT probes.
- -b, --binary <binary>
The profiled executable. If not set, then the command is considered to be the profiled executable and is used as a binary parameter.
- -l, --libs <libs>
Additional libraries that should also be profiled.
- -t, --timeout <timeout>
Set time limit (in seconds) for the profiled command, i.e. the command will be terminated after reaching the time limit. Useful for, e.g., endless commands.
- -z, --zip-temps
Zip and compress the temporary files (SystemTap log, raw performance data, watchdog log, etc.) into the Perun log directory before deleting them.
- -k, --keep-temps
Do not delete the temporary files in the file system.
- -vt, --verbose-trace
Set the trace file output to be more verbose, useful for debugging.
- -q, --quiet
Reduces the verbosity of the collector info messages.
- -w, --watchdog
Enable detailed logging of the whole collection process.
- -o, --output-handling <output_handling>
Sets the output handling of the profiled command: - default: the output is displayed in the terminal - capture: the output is being captured into a file as well as displayed in the terminal (note that buffering causes a delay in the terminal output) - suppress: redirects the output to the DEVNULL
- Options:
default | capture | suppress
- -i, --diagnostics
Enable detailed surveillance mode of the collector. The collector turns on detailed logging (watchdog), verbose trace, capturing output etc. and stores the logs and files in an archive (zip-temps) in order to provide as much diagnostic data as possible for further inspection.
- -sc, --stap-cache-off
Disables the SystemTap caching of compiled scripts.
- -np, --no-profile
Tracer will not transform and save processed data into a perun profile.
- -mcg, --extract-mixed-cg
DEBUG: Extract mixed CG.
- -cg, --only-extract-cg
Tracer will only extract the CG of the current project version and terminate.
- -mt, --max-simultaneous-threads <max_simultaneous_threads>
DEBUG: Maximum number of expected simultaneous threads when sampling is on.
- -nds, --no-ds-update
DEBUG: Disables Dynamic Stats updates
Examples
 1{
 2  "resources": {
 3    "SLList_insert(SLList*, int)#0": {
 4      "amount": [
 5        1, 0, 1, 1
 6      ],
 7      "structure-unit-size": [
 8        0, 1, 2, 3
 9      ]
10    },
11    "SLList_destroy(SLList*)#0": {
12      "amount": [
13        1
14      ],
15      "structure-unit-size": [
16        4
17      ]
18    },
19    "SLList_init(SLList*)#0": {
20      "amount": [
21        6
22      ],
23      "structure-unit-size": [
24        0
25      ]
26    },
27    "SLList_search(SLList*, int)#0": {
28      "amount": [
29        0
30      ],
31      "structure-unit-size": [
32        0
33      ]
34    }
35  },
36  "header": {
37    "workload": "",
38    "type": "mixed",
39    "units": {
40      "mixed(time delta)": "us"
41    },
42    "params": "",
43    "cmd": "../stap-collector/tst"
44  },
45  "models": [],
46  "collector_info": {
47    "params": {
48      "global_sampling": null,
49      "sampling": [
50        {
51          "func": "SLList_insert",
52          "sample": 1
53        },
54        {
55          "func": "func1",
56          "sample": 1
57        }
58      ],
59      "rules": [
60        "SLList_init",
61        "SLList_insert",
62        "SLList_search",
63        "SLList_destroy"
64      ],
65      "method": "custom"
66    },
67    "name": "complexity"
68  },
69  "resource_type_map": {
70    "SLList_insert(SLList*, int)#0": {
71      "subtype": "time delta",
72      "uid": "SLList_insert(SLList*, int)",
73      "time": "6.8e-05s",
74      "type": "mixed"
75    },
76    "SLList_destroy(SLList*)#0": {
77      "subtype": "time delta",
78      "uid": "SLList_destroy(SLList*)",
79      "time": "6.8e-05s",
80      "type": "mixed"
81    },
82    "SLList_init(SLList*)#0": {
83      "subtype": "time delta",
84      "uid": "SLList_init(SLList*)",
85      "time": "6.8e-05s",
86      "type": "mixed"
87    },
88    "SLList_search(SLList*, int)#0": {
89      "subtype": "time delta",
90      "uid": "SLList_search(SLList*, int)",
91      "time": "6.8e-05s",
92      "type": "mixed"
93    }
94  },
95  "postprocessors": [],
96  "origin": "f7f3dcea69b97f2b03c421a223a770917149cfae"
97}
The above is an example of profiled data for the simple manipulation with program with single
linked list. Profile captured running times of three functions—SLList_init (an
initialization of single linked list), SLList_destroy (a destruction of single linked list) and
SLList_search (search over the single linked list).
Highlighted lines show important keys and regions in the profile, e.g. the origin,
collector_info or resources.
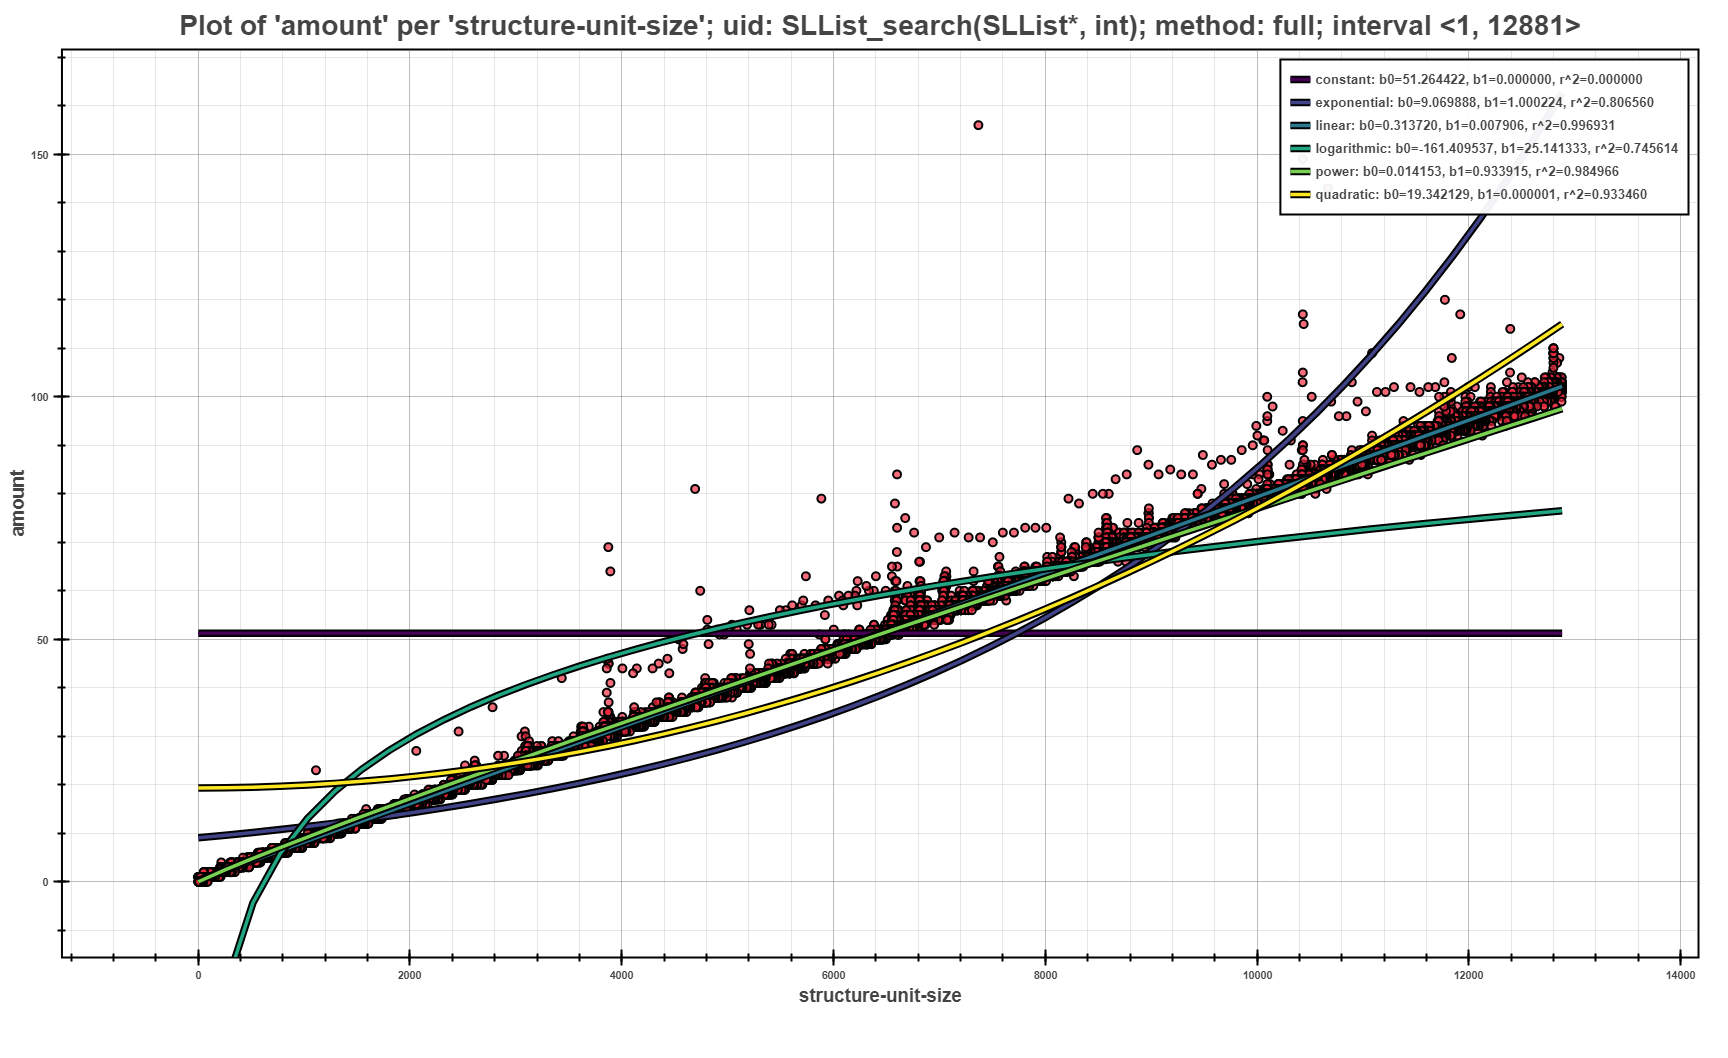
The Scatter Plot above shows the example of visualization of trace profile. Each
points corresponds to the running time of the SLList_search function over the single linked
list with structure-unit-size elements. Elements are further interleaved with set of models
obtained by Regression Analysis. The light green line corresponds to linear
model, which seems to be the most fitting to model the performance of given function.
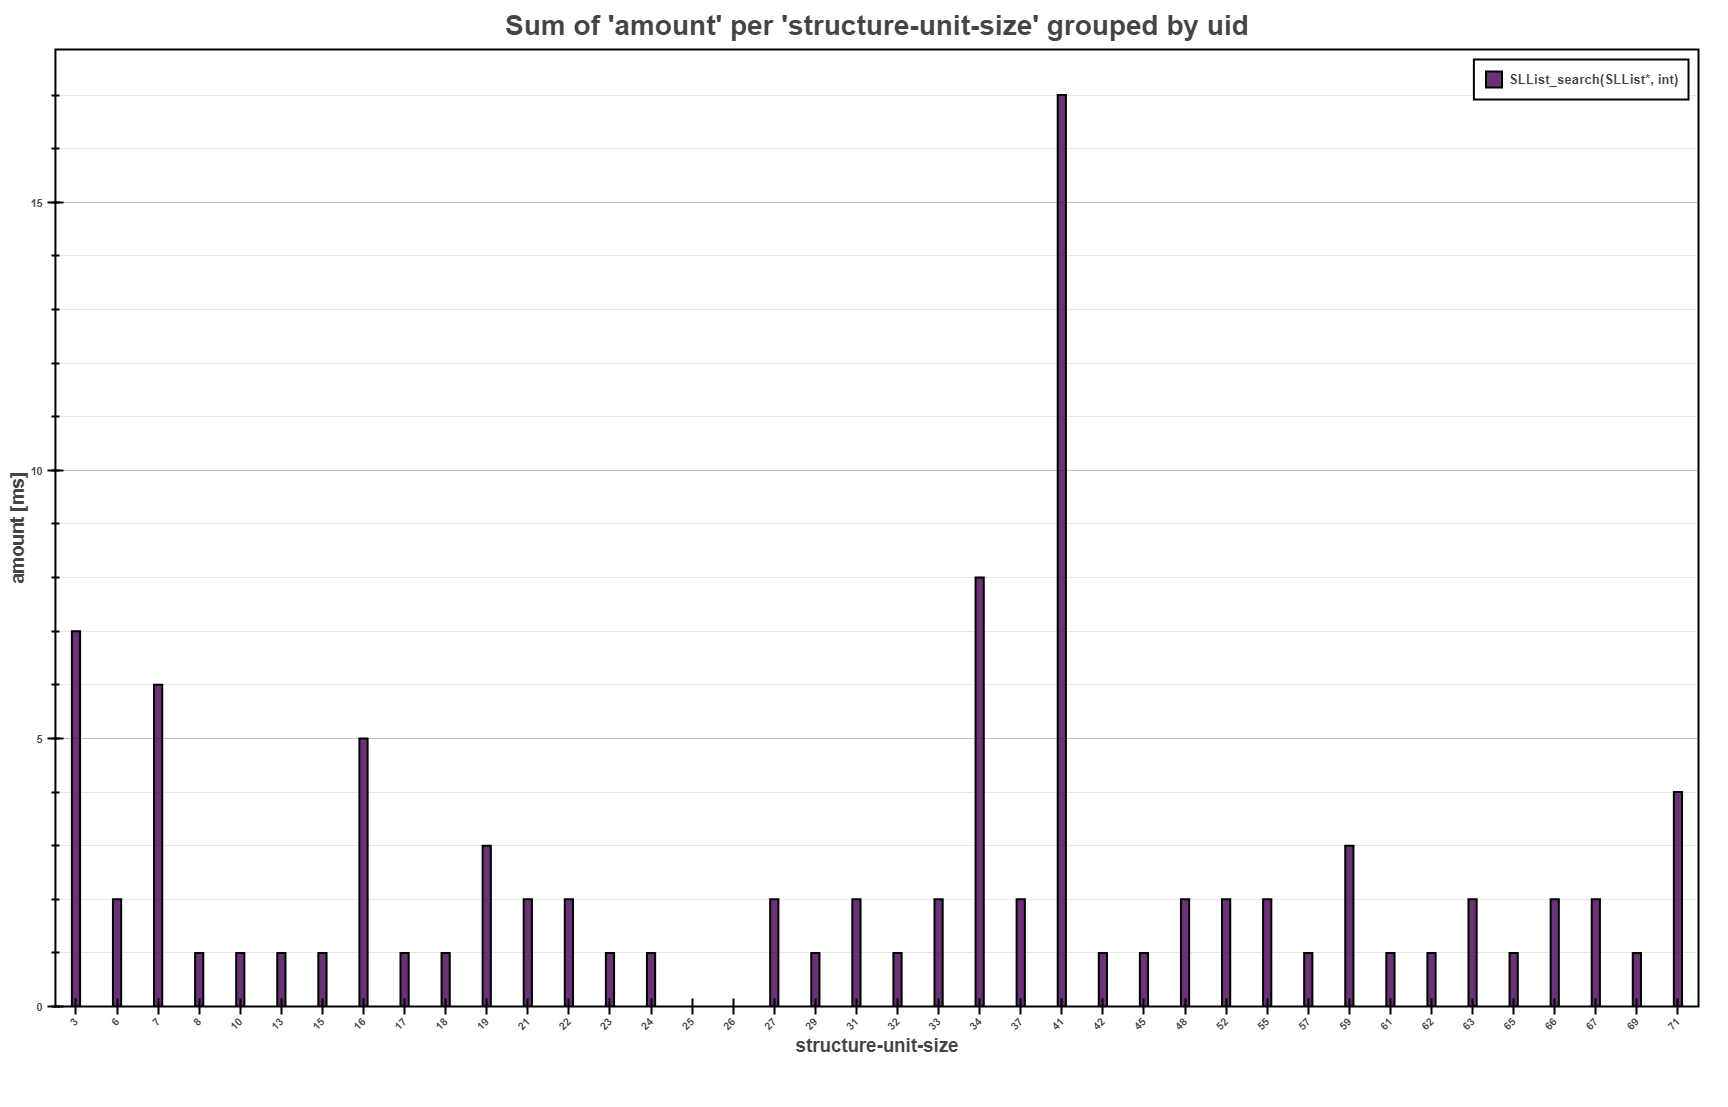
The Bars Plot above shows the overall sum of the running times for each
structure-unit-size for the SLList_search function. The interpretation highlights that the
most of the consumed running time were over the single linked lists with 41 elements.
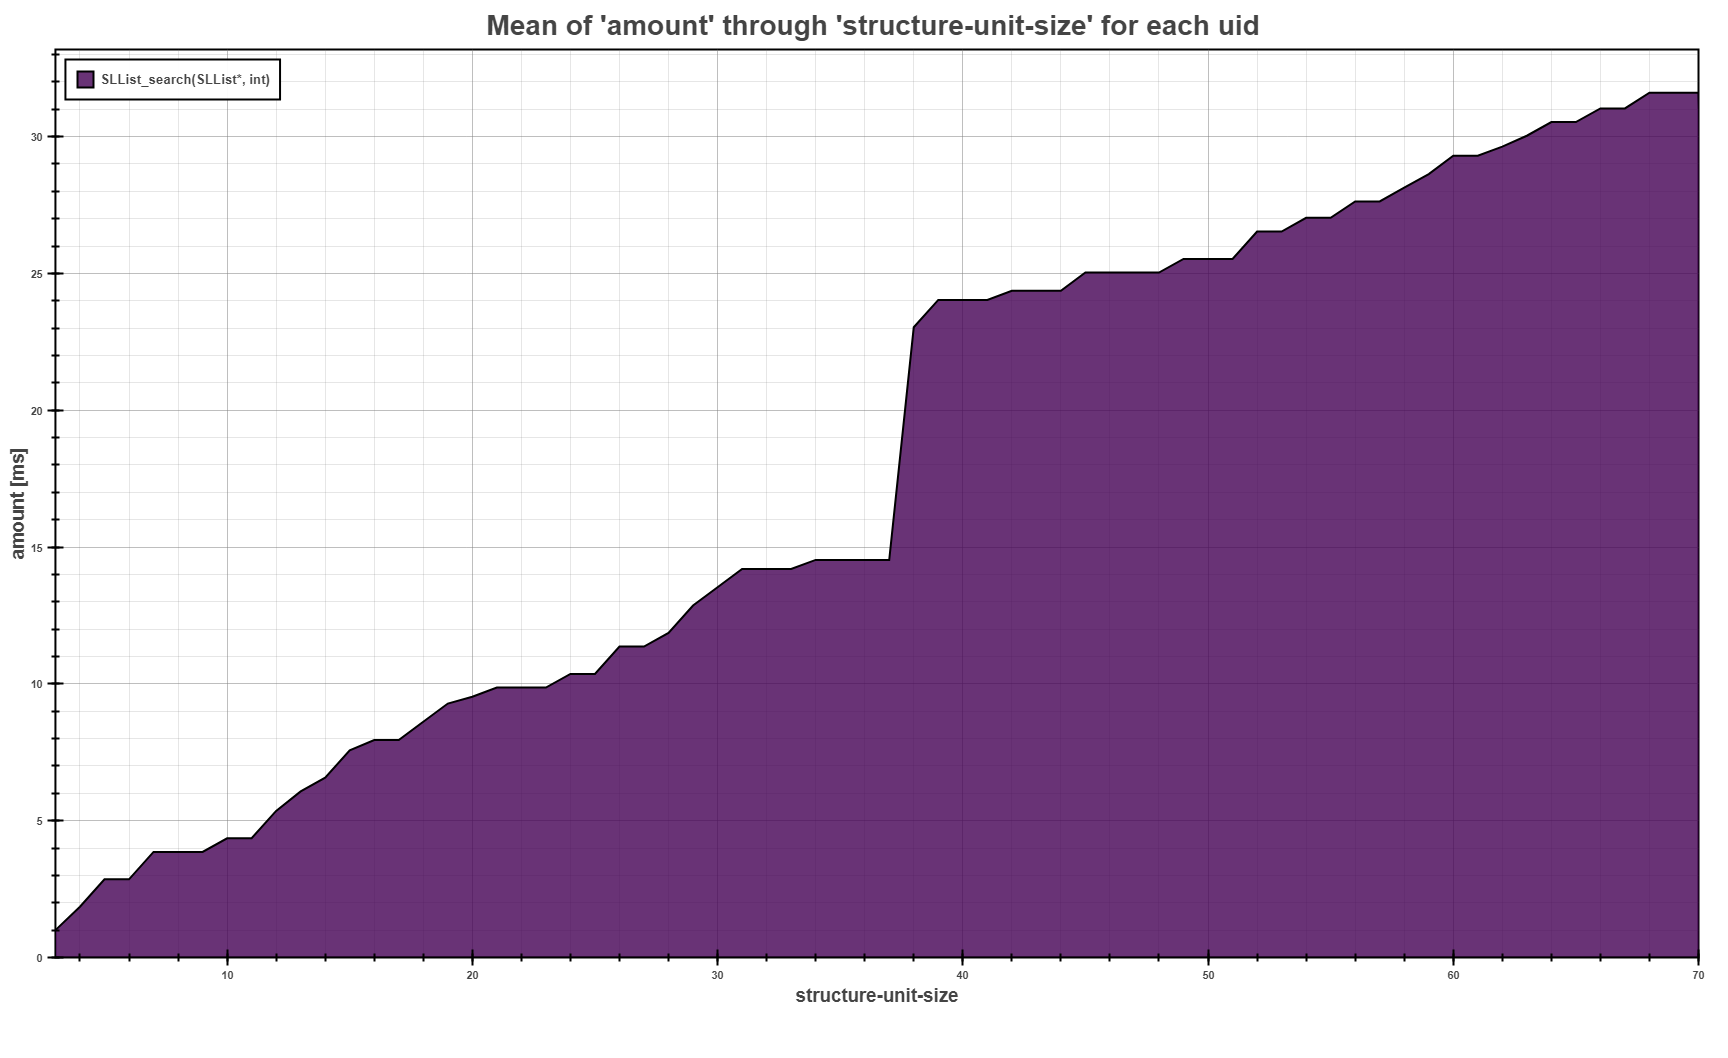
The Flow Plot above shows the trend of the average running time of the SLList_search
function depending on the size of the structure we execute the search on.
Memory Collector
Memory collector collects allocations of C/C++ functions, target addresses of allocations, type of allocations, etc.
Overview and Command Line Interface
perun collect memory
Generates memory performance profile, capturing memory allocations of different types along with target address and full call trace.
libunwind.so and custom libmalloc.soThe following snippet shows the example of resources collected by memory profiler. It captures allocations done by functions with more detailed description, such as the type of allocation, trace, etc.
{
    "type": "memory",
    "subtype": "malloc",
    "address": 19284560,
    "amount": 4,
    "trace": [
        {
            "source": "../memory_collect_test.c",
            "function": "main",
            "line": 22
        },
    ],
    "uid": {
        "source": "../memory_collect_test.c",
        "function": "main",
        "line": 22
    }
},
Refer to Memory Collector for more thorough description and examples of memory collector.
Usage
perun collect memory [OPTIONS]
Options
- -s, --sampling <sampling>
Sets the sampling interval for profiling the allocations. I.e. memory snapshots will be collected each <sampling> seconds.
- --no-source <no_source>
Will exclude allocations done from <no_source> file during the profiling.
- --no-func <no_func>
Will exclude allocations done by <no func> function during the profiling.
- -a, --all
Will record the full trace for each allocation, i.e. it will include all allocators and even unreachable records.
Examples
  1{
  2  "resources": {
  3    "../memory_collect_test.c:main:22#0": {
  4      "amount": [
  5        4
  6      ],
  7      "address": [
  8        19284560
  9      ]
 10    },
 11    "../memory_collect_test.c:main:27#0": {
 12      "amount": [
 13        0
 14      ],
 15      "address": [
 16        19284560
 17      ]
 18    }
 19  },
 20  "header": {
 21    "units": {
 22      "memory": "B"
 23    },
 24    "cmd": "./mct",
 25    "workload": "",
 26    "params": "",
 27    "type": "memory"
 28  },
 29  "models": [],
 30  "collector_info": {
 31    "params": {
 32      "all": false,
 33      "sampling": 0.025,
 34      "no_func": null,
 35      "no_source": null
 36    },
 37    "name": "memory"
 38  },
 39  "resource_type_map": {
 40    "../memory_collect_test.c:main:22#0": {
 41      "snapshot": 0,
 42      "time": "0.025000",
 43      "type": "memory",
 44      "trace": [
 45        {
 46          "function": "malloc",
 47          "line": 0,
 48          "source": "unreachable"
 49        },
 50        {
 51          "function": "main",
 52          "line": 22,
 53          "source": "../memory_collect_test.c"
 54        },
 55        {
 56          "function": "__libc_start_main",
 57          "line": 0,
 58          "source": "unreachable"
 59        },
 60        {
 61          "function": "_start",
 62          "line": 0,
 63          "source": "unreachable"
 64        }
 65      ],
 66      "subtype": "malloc",
 67      "uid": {
 68        "function": "main",
 69        "line": 22,
 70        "source": "../memory_collect_test.c"
 71      }
 72    },
 73    "../memory_collect_test.c:main:27#0": {
 74      "snapshot": 0,
 75      "time": "0.025000",
 76      "type": "memory",
 77      "trace": [
 78        {
 79          "function": "free",
 80          "line": 0,
 81          "source": "unreachable"
 82        },
 83        {
 84          "function": "main",
 85          "line": 27,
 86          "source": "../memory_collect_test.c"
 87        },
 88        {
 89          "function": "__libc_start_main",
 90          "line": 0,
 91          "source": "unreachable"
 92        },
 93        {
 94          "function": "_start",
 95          "line": 0,
 96          "source": "unreachable"
 97        }
 98      ],
 99      "subtype": "free",
100      "uid": {
101        "function": "main",
102        "line": 27,
103        "source": "../memory_collect_test.c"
104      }
105    }
106  },
107  "postprocessors": [],
108  "origin": "74288675e4074f1ad5bbb0d3b3253911ab42267a"
109}
The above is an example of profiled data on a simple binary, which makes several minor allocations.
Profile shows a simple allocation followed by deallocation and highlights important keys and
regions in the memory profiles, e.g. the origin, collector_info or
resources
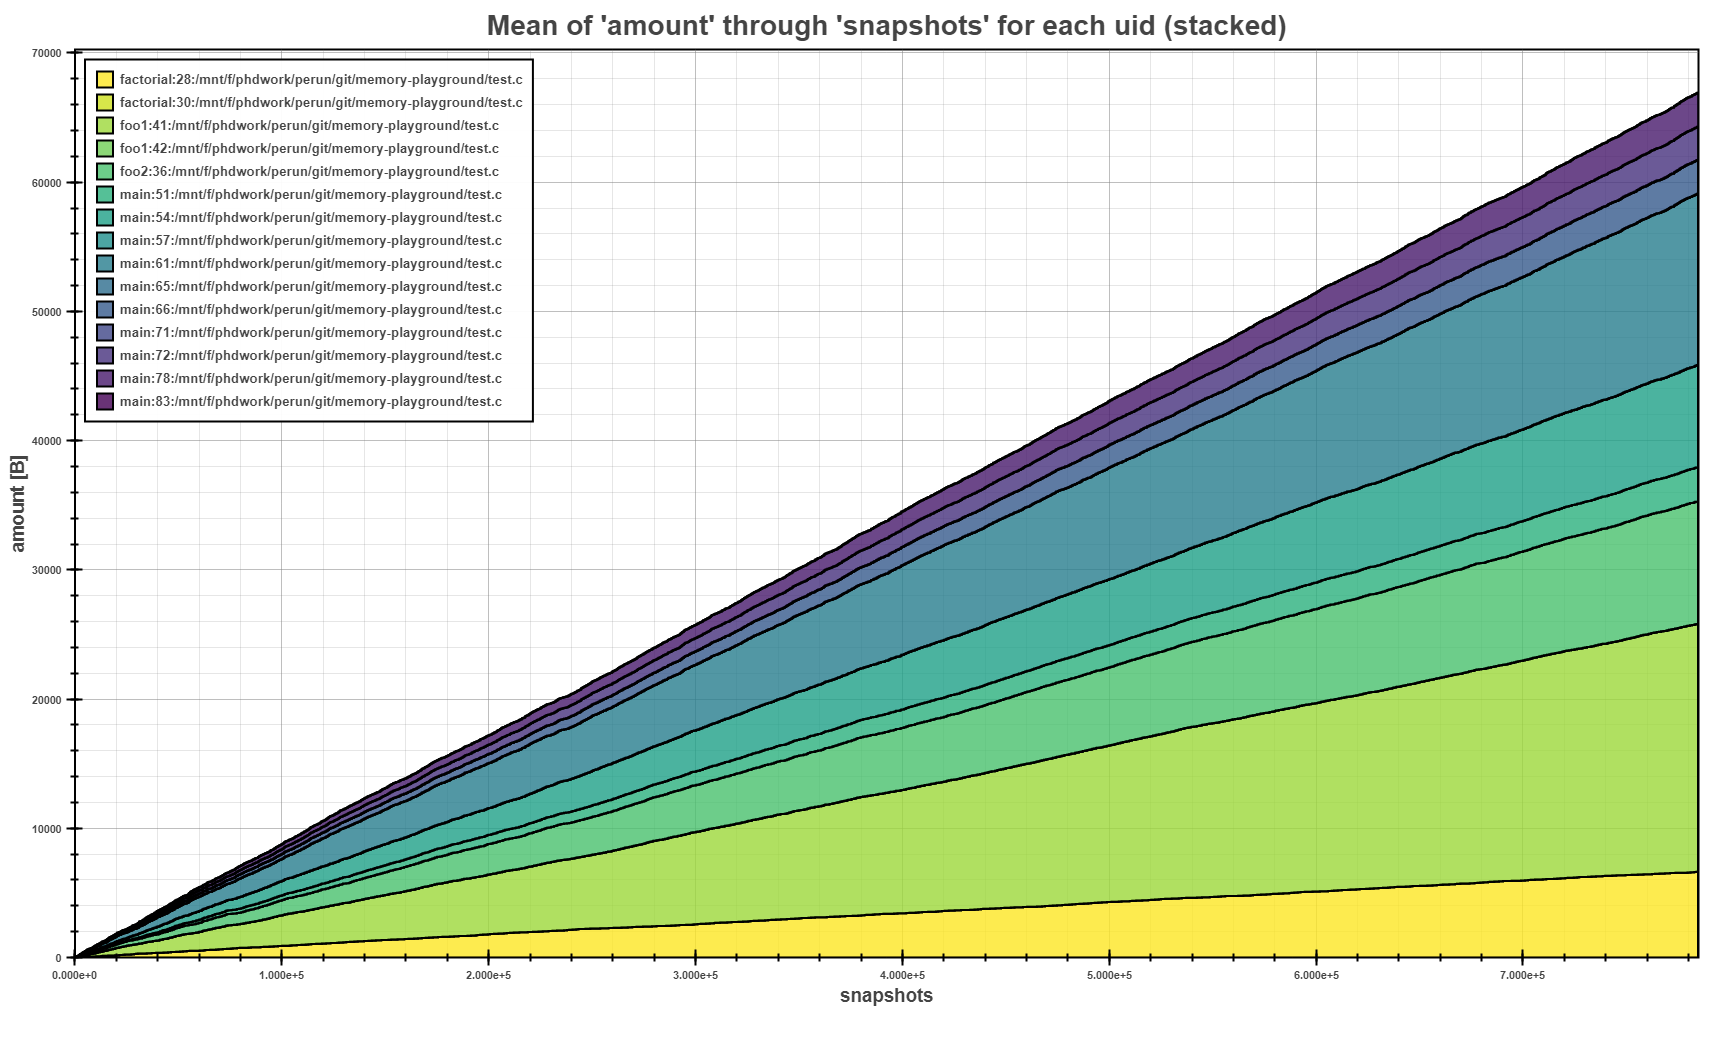
The Flow Plot above shows the mean of allocated amounts per each allocation site (i.e.
uid) in stacked mode. The stacking of the means clearly shows, where the biggest allocations
where made during the program run.
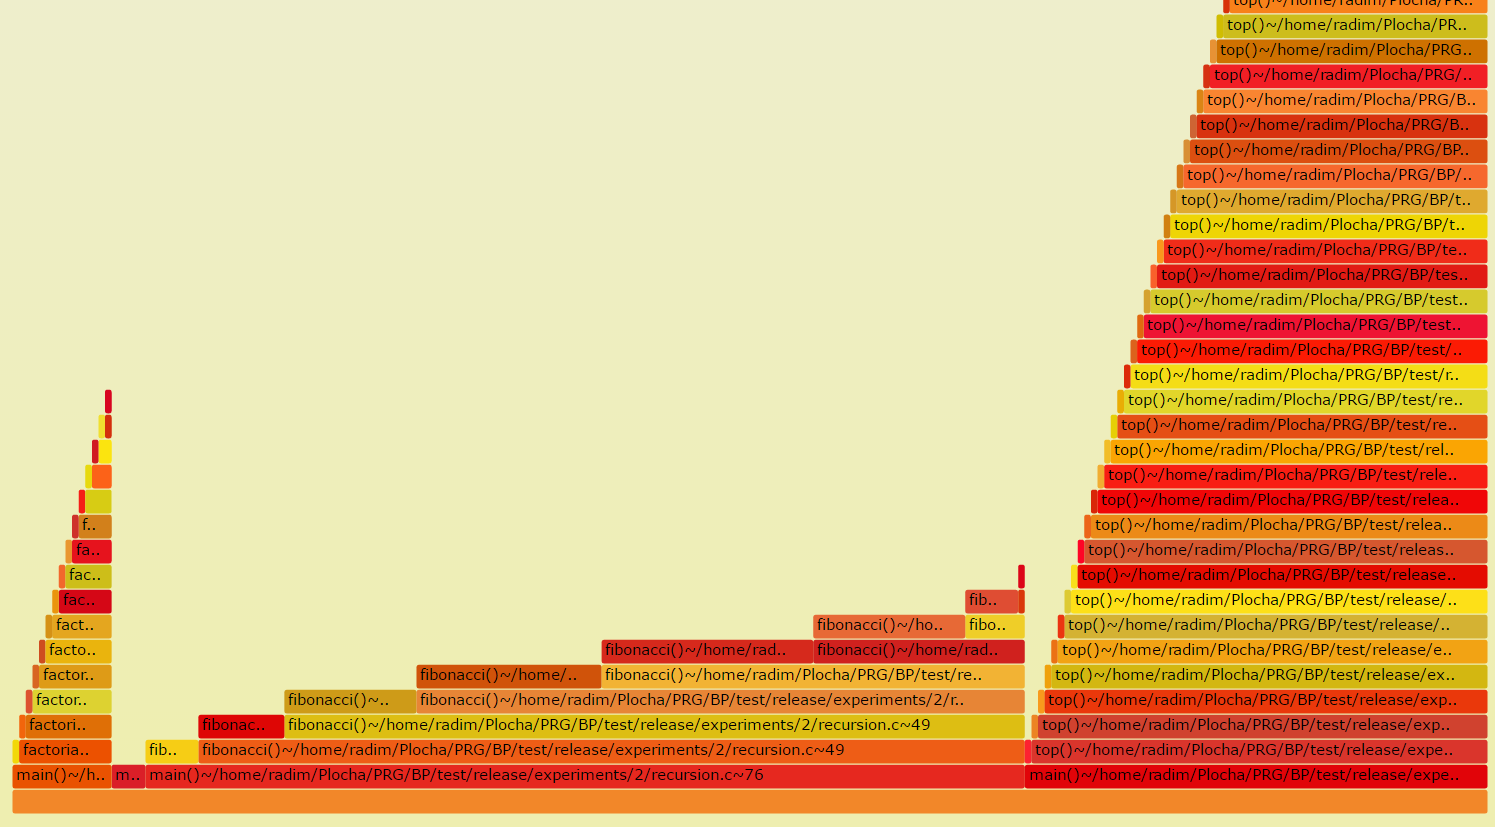
The Flame Graph is an efficient visualization of inclusive consumption of resources. The width of the base of one flame shows the bottleneck and hotspots of profiled binaries.
Time Collector
Time collector collects is a simple wrapper over the time utility. There is nothing special about this, the profiles are simple, and no visualization is especially suitable for this mode.
Overview and Command Line Interface
perun collect time
Generates time performance profile, capturing overall running times of the profiled command.
This is a wrapper over the time linux utility and captures resources
in the following form:
{
    "amount": 0.59,
    "type": "time",
    "subtype": "sys",
    "uid": cmd
    "order": 1
}
Refer to Time Collector for more thorough description and examples of trace collector.
Usage
perun collect time [OPTIONS]
Options
- -w, --warmup <int>
Before the actual timing, the collector will execute <int> warm-up executions.
- -r, --repeat <int>
The timing of the given binaries will be repeated <int> times.
Examples
 1{
 2  "origin": "8de6cd99e4dc36cd73a2af906cde12456e96d9f1",
 3  "header": {
 4    "type": "time",
 5    "params": "",
 6    "units": {
 7      "time": "s"
 8    },
 9    "cmd": "./list_search",
10    "workload": "100000"
11  },
12  "collector_info": {
13    "params": {
14      "repeat": 2,
15      "warmup": 3
16    },
17    "name": "time"
18  },
19  "postprocessors": [],
20  "global": {
21    "timestamp": 0.565476655960083,
22    "resources": [
23      {
24        "subtype": "real",
25        "uid": "./list_search",
26        "order": 1,
27        "type": "time",
28        "amount": 0.26
29      },
30      {
31        "subtype": "user",
32        "uid": "./list_search",
33        "order": 1,
34        "type": "time",
35        "amount": 0.25
36      },
37      {
38        "subtype": "sys",
39        "uid": "./list_search",
40        "order": 1,
41        "type": "time",
42        "amount": 0.0
43      },
44      {
45        "subtype": "real",
46        "uid": "./list_search",
47        "order": 2,
48        "type": "time",
49        "amount": 0.27
50      },
51      {
52        "subtype": "user",
53        "uid": "./list_search",
54        "order": 2,
55        "type": "time",
56        "amount": 0.28
57      },
58      {
59        "subtype": "sys",
60        "uid": "./list_search",
61        "order": 2,
62        "type": "time",
63        "amount": 0.0
64      }
65    ]
66  },
67}
The above is an example of profiled data using the time wrapper with important regions and keys highlighted. The given command was profiled two times.
Bounds Collector
Automatic analysis of resource bounds of C programs.
Bounds collector employs a technique of Loopus tool (see loopus-site), which performs an amortized analysis of input C program. Loopus is limited to integer programs only, and for each function and for each loop it computes a symbolic bound (e.g. 2*n + max(0, m)). Moreover, it computes the big-O notation highlighting the main source of the complexity.
Overview and Command Line Interface
perun collect bounds
- Generates memory performance profile, capturing memory allocations of
different types along with target address and full call trace.
Limitations: C/C++ binaries
Metric: memory
Dependencies:
libunwind.soand customlibmalloc.soDefault units: B for memory
The following snippet shows the example of resources collected by memory profiler. It captures allocations done by functions with more detailed description, such as the type of allocation, trace, etc.
{
        "uid": {
            "source": "../test.c",
            "function": "main",
            "line": 22
            "column": 40
        }
        "bound": "1 + max(0, (k + -1))",
        "class": "O(n^1)"
        "type": "bound",
}

Refer to :ref:`collectors-bounds` for more thorough description and
examples of `bounds` collector.
Usage
perun collect bounds [OPTIONS]
Options
- -s, --source, --src <path>
Source C file that will be analyzed.
- -d, --source-dir <dir>
Directory, where source C files are stored. All of the existing files with valid extensions (.c).
Examples
 1{
 2  "origin": "409dd7468a328038c9a1ea5a6a0f7baa89f8997a",
 3  "header": {
 4    "type": "bound",
 5    "args": "",
 6    "workload": "",
 7    "units": {
 8      "bound": "iterations"
 9    },
10    "cmd": "partitioning"
11  },
12  "resources": {
13    "int_partitioning.c:partitioning:34:42#0": {},
14    "int_partitioning.c:partitioning:49:60#0": {},
15    "int_partitioning.c:partitioning:64:69#0": {},
16    "int_partitioning.c:partitioning:18:4#0": {},
17    "int_partitioning.c:partitioning:55:58#0": {}
18  },
19  "models": [],
20  "postprocessors": [],
21  "collector_info": {
22    "params": {
23      "sources": [
24        "int_partitioning.c"
25      ],
26      "workload": "",
27      "source_dir": [],
28      "source": [
29        "int_partitioning.c"
30      ]
31    },
32    "name": "bounds"
33  },
34  "resource_type_map": {
35    "int_partitioning.c:partitioning:34:42#0": {
36      "uid": {
37        "line": 34,
38        "column": 42,
39        "source": "int_partitioning.c",
40        "function": "partitioning"
41      },
42      "type": "local bound",
43      "bound": "1 + max(0, (k + -1))",
44      "time": "0.0",
45      "class": "O(n^1)"
46    },
47    "int_partitioning.c:partitioning:49:60#0": {
48      "uid": {
49        "line": 49,
50        "column": 60,
51        "source": "int_partitioning.c",
52        "function": "partitioning"
53      },
54      "type": "local bound",
55      "bound": "2 + max(0, (k + -1))",
56      "time": "0.0",
57      "class": "O(n^1)"
58    },
59    "int_partitioning.c:partitioning:64:69#0": {
60      "uid": {
61        "line": 64,
62        "column": 69,
63        "source": "int_partitioning.c",
64        "function": "partitioning"
65      },
66      "type": "local bound",
67      "bound": "2 + max(0, (k + -1))",
68      "time": "0.0",
69      "class": "O(n^1)"
70    },
71    "int_partitioning.c:partitioning:18:4#0": {
72      "uid": {
73        "line": 18,
74        "column": 4,
75        "source": "int_partitioning.c",
76        "function": "partitioning"
77      },
78      "type": "total bound",
79      "bound": "6 + 4 × max(0, (k + -1))",
80      "time": "0.0",
81      "class": "O(n^1)"
82    },
83    "int_partitioning.c:partitioning:55:58#0": {
84      "uid": {
85        "line": 55,
86        "column": 58,
87        "source": "int_partitioning.c",
88        "function": "partitioning"
89      },
90      "type": "local bound",
91      "bound": "1 + max(0, (k + -1))",
92      "time": "0.0",
93      "class": "O(n^1)"
94    }
95  }
96}
The above is an example of profiled data using the bounds with important regions and keys highlighted. The bounds corresponds to the program listed below, which contains four highlighted loops. For each loop we have a local bound that is represented as a ranking function based on input function parameters. For each bound, we also list its class, i.e. the highest polynom of the ranking function, or Big-O complexity. In case, the complexity cannot be inferred, the Loopus returns failure and we report infinite bound, which is safe approximation. Each function then gets a cummulative total bound, that represents the whole complexity of the function.
 1int partitioning(unsigned int k) {
 2    TList *list, *temp;
 3
 4    unsigned int list_next_NULL;
 5    unsigned int list_next_p;
 6    unsigned int p_next_NULL;
 7    unsigned int x_next_NULL;
 8    unsigned int y_next_x;
 9    list = malloc(sizeof(TList));
10    list->next = NULL;
11
12    // Create nondeterminstic list
13    TList *p = list;
14    list_next_NULL = 1;
15    list_next_p = 0;
16    while(k > 1) {
17        temp = malloc(sizeof(TList));
18        temp->next = NULL;
19        p->next = temp;
20        p = temp;
21        list_next_NULL = list_next_p + 2;
22        list_next_p += 1;
23        --k;
24    }
25
26    // Traverse the list
27    TList* x = list;
28    TList* y = x;
29    x_next_NULL = list_next_NULL;
30    y_next_x = 0;
31    while(x_next_NULL > 0 && x != NULL) {
32        x = x->next;
33        x_next_NULL -= 1;
34        y_next_x += 1;
35        // The end will always jump out
36        if(NONDET) {
37            while(y_next_x > 0 && y != x) {
38                y = y->next;
39                y_next_x -= 1;
40            }
41        }
42    }
43
44    p = list;
45    p_next_NULL = list_next_NULL;
46    while(p_next_NULL > 0 && p != NULL) {
47        temp = p;
48        p = p->next;
49        free(temp);
50        p_next_NULL -= 1;
51    }
52
53    return 0;
54}
55
Creating your own Collector
New collectors can be registered within Perun in several steps. Internally they can be implemented
in any programming language and in order to work with Perun requires three phases to be specified
as given in Collectors Overview—before(), collect() and after(). Each new
collector requires a interface module run.py, which contains the three functions and, moreover,
a cli API for Click.
You can register your new collector as follows:
Run
perun utils create collect mycollectorto generate a new modules inperun/collectdirectory with the following structure. The command takes a predefined templates for new collectors and creates__init__.pyandrun.pyaccording to the supplied command line arguments (see Utility Commands for more information about interface ofperun utils createcommand):/perun |-- /collect |-- /mycollector |-- __init__.py |-- run.py |-- /trace |-- /memory |-- /time |-- __init__.pyFirst, implement the
__init__.pyfile, including the module docstring with brief collector descriptions and definitions of constants that are used for automatic setting of profiles (namely thecollector_info) which has the following structure:1"""...""" 2 3COLLECTOR_TYPE = "time|memory|mixed" 4COLLECTOR_DEFAULT_UNITS = {"type": "unit"}
Next, implement the
run.pymodule withcollect()function, (optionally withbefore()andafter()). Thecollect()function should do the actual collection of the profiling data over the given configuration. Each function should return the integer status of the phase, the status message (used in case of error) and dictionary including params passed to additional phases and ‘profile’ with dictionary w.r.t Specification of Profile Format.1def before(**kwargs): 2 """(optional)""" 3 return STATUS, STATUS_MSG, dict(kwargs) 4 5 6def collect(**kwargs): 7 """...""" 8 return STATUS, STATUS_MSG, dict(kwargs) 9 10 11def after(**kwargs): 12 """(optional)""" 13 return STATUS, STATUS_MSG, dict(kwargs)
Additionally implement the command line interface function in
run.py, named the same as your collector. This function will is called from command line asperun collect mycollectorand is based on Click library.1--- /home/runner/work/perun/perun/docs/_static/templates/collectors_run.py 2+++ /home/runner/work/perun/perun/docs/_static/templates/collectors_run_api.py 3@@ -1,3 +1,8 @@ 4+import click 5+ 6+import perun.logic.runner as runner 7+ 8+ 9 def before(**kwargs): 10 """(optional)""" 11 return STATUS, STATUS_MSG, dict(kwargs) 12@@ -11,3 +16,10 @@ 13 def after(**kwargs): 14 """(optional)""" 15 return STATUS, STATUS_MSG, dict(kwargs) 16+ 17+ 18+@click.command() 19+@click.pass_context 20+def mycollector(ctx, **kwargs): 21+ """...""" 22+ runner.run_collector_from_cli_context(ctx, "mycollector", kwargs)
Finally register your newly created module in function
get_supported_module_nameslocated inperun.utils.common.cli_kit.py:1--- /home/runner/work/perun/perun/docs/_static/templates/supported_module_names.py 2+++ /home/runner/work/perun/perun/docs/_static/templates/supported_module_names_collectors.py 3@@ -4,7 +4,7 @@ 4 error(f"trying to call get_supported_module_names with incorrect package '{package}'") 5 return { 6 "vcs": ["git", "svs"], 7- "collect": ["trace", "memory", "time"], 8+ "collect": ["trace", "memory", "time", "mycollector"], 9 "postprocess": [ 10 "moving-average", 11 "kernel-regression",
Preferably, verify that registering did not break anything in the Perun and if you are not using the developer installation, then reinstall Perun:
make test
make install
At this point you can start using your collector either using
perun collector using the following to set the job matrix and run the batch collection of profiles:perun config edit perun run matrixIf you think your collector could help others, please, consider making Pull Request.